This blog is a free service since the beginning. If this site has contributed to your trading/investing style in any way and you feel generous today, there are two donation buttons on the left side. Thanks for supporting this site by turning off your ad-block software and visiting the adverts.
Subscribe to:
Post Comments
(
Atom
)


http://tinypic.com/view.php?pic=2zow4z4&s=5#.Um1yi6OnzFp
ReplyDeleteWould welcome your comments
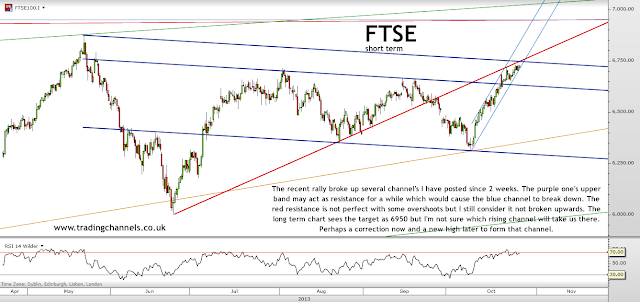
Would welcome your thoughts on my ftse analysis
Duncan,
ReplyDeleteThe two white lines don't have origins shown in red circles. In addition, I wouldn't allow the large overshoots (blue circles) while drawing the lines. I like very sharp drawn lines with no or very small overshoots. That's why I didn't see any resistance from 1999 and 2007 tops. But my FTSE chart today has the 1999 top as a resistance.